


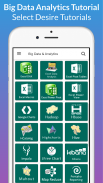

Learn All Big Data Analytics Tutorial Offline 2020
คำอธิบายของLearn All Big Data Analytics Tutorial Offline 2020
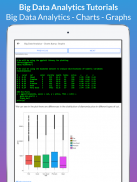
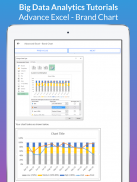
Learn Advanced Excel Charts
Excel charts are an efficient means to visualize the data to convey the results in 2020.
Learn Advanced Excel Functions
This Microsoft Excel tutorial teaches you how to create and use Excel functions. You can use Excel functions to perform various mathematical, statistical, logical calculations by 2020.
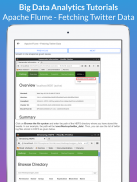
Learn Apache Flume
Flume is a standard, simple, robust, flexible, and extensible tool for data ingestion from various data producers (webservers) into Hadoop. In this tutorial,
Learn Apache Kafka
Apache Kafka was originated at LinkedIn and later became an open sourced Apache project in 2011, then First-class Apache project in 2012.
Apache Pig is an abstraction over MapReduce. It is a tool/platform which is used to analyze larger sets of data representing them as data flows
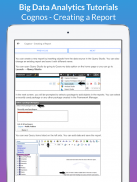
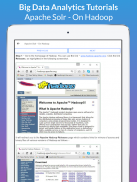
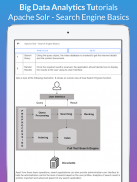
Learn Apache Solr
Solr is a scalable, ready to deploy, search/storage engine optimized to search large volumes of text-centric data 2020.
Learn Apache Spark
Apache Spark is a lightning-fast cluster computing designed for fast computation.
Learn Apache Storm
Storm was originally created by Nathan Marz and team at BackType. BackType is a social analytics company.
Learn Apache Tajo
Apache Tajo is an open-source distributed data warehouse framework for Hadoop.
Learn Avro
Apache Avro is a language-neutral data serialization system, developed by Doug Cutting, the father of Hadoop.
Learn AWS Quicksight
AWS Quicksight is an AWS based Business Intelligence and visualization tool
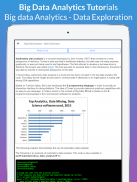
Learn Big Data Analytics
The volume of data that one has to deal has exploded to unimaginable levels in the past decade, and at the same time, the price of data storage has systematically reduced. Private companies and research institutions capture terabytes of data about their users’ interactions, business, social media, and also sensors from devices such as mobile phones and automobiles.
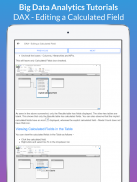
Learn Excel Dax
DAX (Data Analysis Expressions) is a formula language that helps you create new information from the data that already exists in your Data Model
Learn Excel Data Analysis
Data Analysis with Excel is a comprehensive tutorial that provides a good insight into the latest and advanced features available in Microsoft Excel.
Learn Excel Pivot Tables
PivotTable is an extremely powerful tool that you can use to slice and dice data.
Learn Excel Macros
An Excel macro is an action or a set of actions that you can record, give a name, save and run as many times as you want and whenever you want.
Learn Excel Power Pivot
Excel Power Pivot is an efficient, powerful tool that comes with Excel as an Add-in.
Learn Excel Power View
Power View enables interactive data exploration, visualization, and presentation that encourages intuitive ad-hoc reporting.
Learn Google Charts
Google Charts is a pure JavaScript based charting library meant to enhance web applications by adding interactive charting capability.
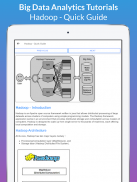
Learn Hadoop
Hadoop is an open-source framework that allows to store and process big data in a distributed environment across clusters of computers using simple programming models.
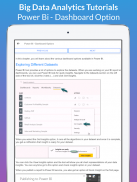
Learn Power BI
Power BI is a Data Visualization and Business Intelligence tool that converts data from different data sources to interactive dashboards and BI reports.
Learn QlikView
QlikView is a leading Business Discovery Platform.
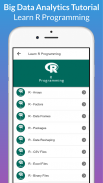
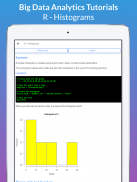
Learn R Programming
R is a programming language and software environment for statistical analysis, graphics representation and reporting.
Learn SAS
SAS is a leader in business analytics. Through innovative analytics it caters to business intelligence and data management software and services.
Learn Spark SQL
Apache Spark is a lightning-fast cluster computing designed for fast computation. It was built on top of Hadoop.
Learn Statistics
This Statistics preparation material will cover the important concepts of Statistics syllabus. It contains chapters discussing all the basic concepts of Statistics with suitable
เรียนรู้แผนภูมิ Excel ขั้นสูง
แผนภูมิ Excel เป็นวิธีที่มีประสิทธิภาพในการแสดงข้อมูลเพื่อแสดงผลลัพธ์ในปี 2020
เรียนรู้ฟังก์ชัน Excel ขั้นสูง
บทช่วยสอน Microsoft Excel นี้สอนวิธีสร้างและใช้ฟังก์ชัน Excel คุณสามารถใช้ฟังก์ชัน Excel เพื่อทำการคำนวณทางคณิตศาสตร์สถิติและตรรกะในปี 2020
เรียนรู้ Apache Flume
Flume เป็นเครื่องมือมาตรฐานเรียบง่ายยืดหยุ่นและยืดขยายได้สำหรับการนำเข้าข้อมูลจากผู้ผลิตข้อมูล (เว็บเซิร์ฟเวอร์) ไปยัง Hadoop ในบทช่วยสอนนี้
เรียนรู้ Apache Kafka
Apache Kafka มีต้นกำเนิดที่ LinkedIn และต่อมากลายเป็นโครงการ Apache เปิดแหล่งที่มาในปี 2011 จากนั้นโครงการ Apache ชั้นหนึ่งในปี 2012
Apache Pig เป็นนามธรรมเหนือ MapReduce เป็นเครื่องมือ / แพลตฟอร์มที่ใช้ในการวิเคราะห์ชุดข้อมูลขนาดใหญ่ที่แสดงถึงการไหลของข้อมูล
เรียนรู้ Apache Solr
Solr เป็นเอ็นจิ้นค้นหา / จัดเก็บข้อมูลที่ปรับขนาดได้พร้อมปรับใช้พร้อมปรับให้เหมาะสมเพื่อค้นหาข้อมูลจำนวนมากที่มีข้อความเป็นศูนย์กลางในปี 2020
เรียนรู้ Apache Spark
Apache Spark คือการประมวลผลแบบคลัสเตอร์รวดเร็วที่ออกแบบมาเพื่อการคำนวณที่รวดเร็ว
เรียนรู้ Apache Storm
Storm เดิมถูกสร้างโดย Nathan Marz และทีมที่ BackType BackType เป็น บริษัท วิเคราะห์โซเชียล
เรียนรู้ Apache Tajo
Apache Tajo เป็นกรอบข้อมูลคลังข้อมูลแบบกระจายโอเพ่นซอร์สสำหรับ Hadoop
เรียนรู้รว์
Apache Avro เป็นระบบจัดลำดับข้อมูลที่ไม่เป็นภาษาซึ่งพัฒนาโดย Doug Cutting” ซึ่งเป็นบิดาของ Hadoop
เรียนรู้ AWS Quicksight
AWS Quicksight เป็นเครื่องมือทางธุรกิจและการสร้างภาพข้อมูลบน AWS
เรียนรู้การวิเคราะห์ข้อมูลขนาดใหญ่
ปริมาณข้อมูลที่มีการจัดการได้ขยายไปถึงระดับที่ไม่สามารถจินตนาการได้ในทศวรรษที่ผ่านมาและในเวลาเดียวกันราคาของการจัดเก็บข้อมูลก็ลดลงอย่างเป็นระบบ บริษัท เอกชนและสถาบันการวิจัยรวบรวมข้อมูลจำนวนเทราไบต์เกี่ยวกับการโต้ตอบของผู้ใช้ธุรกิจโซเชียลมีเดียและเซ็นเซอร์จากอุปกรณ์เช่นโทรศัพท์มือถือและรถยนต์
เรียนรู้ Excel Dax
DAX (นิพจน์การวิเคราะห์ข้อมูล) เป็นภาษาสูตรที่ช่วยให้คุณสร้างข้อมูลใหม่จากข้อมูลที่มีอยู่แล้วในตัวแบบข้อมูลของคุณ
เรียนรู้การวิเคราะห์ข้อมูลของ Excel
การวิเคราะห์ข้อมูลด้วย Excel เป็นบทช่วยสอนที่ครอบคลุมซึ่งให้ข้อมูลเชิงลึกที่ดีเกี่ยวกับคุณลักษณะล่าสุดและขั้นสูงที่มีอยู่ใน Microsoft Excel
เรียนรู้ Excel Pivot Tables
PivotTable เป็นเครื่องมือที่ทรงพลังอย่างยิ่งที่คุณสามารถใช้เพื่อเชือดและลูกเต๋าข้อมูล
เรียนรู้ Excel แมโคร
แมโคร Excel คือการกระทำหรือชุดของการกระทำที่คุณสามารถบันทึกตั้งชื่อบันทึกและเรียกใช้หลาย ๆ ครั้งตามที่คุณต้องการและเมื่อใดก็ตามที่คุณต้องการ
เรียนรู้ Excel Power Pivot
Excel Power Pivot เป็นเครื่องมือที่มีประสิทธิภาพและทรงพลังที่มาพร้อมกับ Excel เป็น Add-in
เรียนรู้ Excel Power View
Power View เปิดใช้งานการสำรวจข้อมูลแบบอินเทอร์แอกทีฟวิชวลไลเซชันและงานนำเสนอที่สนับสนุนการรายงานแบบเฉพาะกิจ
เรียนรู้ Google Charts
Google Charts เป็นไลบรารี่ที่สร้างจากจาวาสคริปต์ที่มีไว้เพื่อปรับปรุงเว็บแอปพลิเคชันโดยการเพิ่มความสามารถในการสร้างแผนภูมิเชิงโต้ตอบ
เรียนรู้ Hadoop
Hadoop เป็นเฟรมเวิร์กโอเพนซอร์ซที่ช่วยให้สามารถจัดเก็บและประมวลผลข้อมูลขนาดใหญ่ในสภาพแวดล้อมแบบกระจายข้ามกลุ่มคอมพิวเตอร์โดยใช้โมเดลการเขียนโปรแกรมอย่างง่าย
เรียนรู้ Power BI
Power BI เป็นเครื่องมือสร้างภาพข้อมูลและข่าวกรองธุรกิจที่แปลงข้อมูลจากแหล่งข้อมูลต่าง ๆ ไปยังแผงควบคุมแบบโต้ตอบและรายงาน BI
เรียนรู้ QlikView
QlikView เป็นแพลตฟอร์มการค้นพบทางธุรกิจชั้นนำ
เรียนรู้การเขียนโปรแกรม R
R คือภาษาการเขียนโปรแกรมและสภาพแวดล้อมซอฟต์แวร์สำหรับการวิเคราะห์เชิงสถิติการแสดงกราฟิกและการรายงาน
เรียนรู้ SAS
SAS เป็นผู้นำในการวิเคราะห์ธุรกิจ ผ่านการวิเคราะห์เชิงนวัตกรรมมันให้ความสำคัญกับระบบธุรกิจอัจฉริยะและซอฟต์แวร์การจัดการข้อมูลและบริการ
เรียนรู้ Spark SQL
Apache Spark คือการประมวลผลแบบคลัสเตอร์รวดเร็วที่ออกแบบมาเพื่อการคำนวณที่รวดเร็ว มันถูกสร้างขึ้นบน Hadoop
เรียนรู้สถิติ
เนื้อหาการเตรียมสถิตินี้จะครอบคลุมแนวคิดที่สำคัญของหลักสูตรสถิติ มันมีบทที่พูดคุยแนวคิดพื้นฐานทั้งหมดของสถิติอย่างเหมาะสม
Learn All Big Data Analytics Tutorial Offline 2020--เวอร์ชั่น0.0.11
(27-11-2020)Learn All Big Data Analytics Tutorial Offline 2020 - ข้อมูล APK
เวอร์ชั่น APK: 0.0.11แพ็คเกจ: com.pit.bigdataanalyticsเวอร์ชั่นล่าสุดของLearn All Big Data Analytics Tutorial Offline 2020
เวอร์ชั่นอื่น


 4.15
4.15


แอปในประเภทเดียวกัน